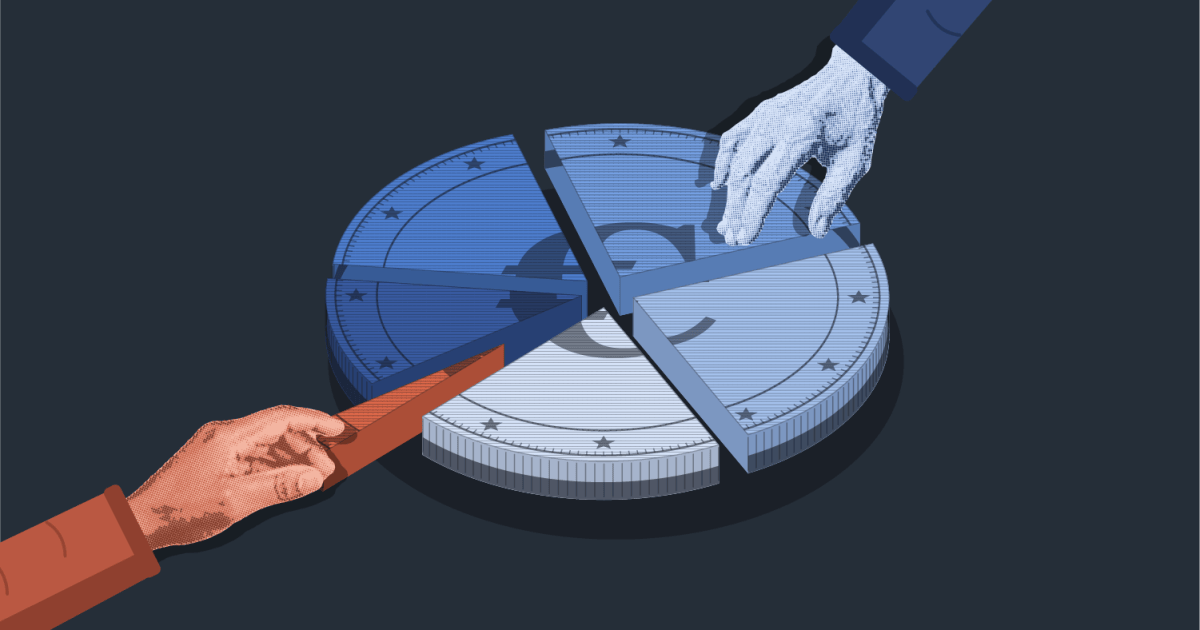

Student protests that began in September in France have spread to more than 11 European countries as anger rises over high rents and fuel prices and cuts to public services.
Many young protesters said they no longer expect to be better off than their parents, and household wealth data show a wide gap between generations.
Across the eurozone and two other European countries, households headed by someone under 35 have a median net wealth of about 25,000 euros ($27,870) while those headed by 55- to 64-year-olds are worth about 208,000 euros ($231,882), more than eight times as much, according to the European Central Bank’s (ECB’s) 2023 Household Finance and Consumption Survey.
In this visual explainer, Al Jazeera compares wealth by age groups across 22 European countries and looks at how much more expensive life has become since 2000.
Where is the wealth gap widest?
The Household Finance and Consumption Survey, run by the ECB and national central banks since 2010, tracks household wealth and debt in the eurozone, the Czech Republic and Hungary.
It measures net wealth, which includes property, cars, valuables and savings, minus debts. Under-35s hold just 2.8 percent of all household wealth in the 22 countries while 55- to 64-year-olds hold the largest share at 24 percent.
In Finland, under-35s hold 0.8 percent of household wealth, the lowest share of any country surveyed, while over-55s hold more than 71 percent. Young people’s shares are also small in Ireland (1.4 percent), Austria (1.6 percent), Greece (1.8 percent) and Germany (2 percent).
Advertisement
Rising housing costs mean many young people cannot afford what their parents or grandparents could.
Wealth is more evenly spread in Central and Eastern Europe. In Lithuania, under-35s hold 13.2 percent, against 15.9 percent for 55- to 64-year-olds. Their share is 12.3 percent in Croatia, 10.1 percent in Slovakia and 9.8 percent in Estonia. Malta, at 11.1 percent, is the exception outside the two regions.
The graphic below shows how household wealth is split between age groups in each country surveyed.

“What we’ve seen is actually a very strong increase in housing prices both in terms of the rental market as well as the ownership market,” Evelyn Astor of the European Social Observatory told Al Jazeera’s Counting the Cost programme.
“All of this is also reinforcing a sense of inequality because ultimately ordinary families are struggling to pay their rents or be able to purchase their homes whereas wealthy people with capital are able to make rather significant investments in the European housing market,” she said.
How much more expensive is it than 2000?
Prices of everyday goods and services, such as food, energy, transport and household bills, have risen by 67.2 percent in the eurozone, Hungary and the Czech Republic since 2000.
Of the countries in our chart, Hungary has seen the steepest rise with prices more than tripling, according to Eurostat, the European Union’s statistics agency. Its harmonised index of consumer prices is the EU’s official measure of how much everyday goods and services cost.
The chart below shows how consumer prices have changed in each country since 2000 with prices in 2000 set at 100 on the index.
Eastern European countries have seen the sharpest increases – particularly since 2022 when Russia’s full-scale invasion of Ukraine began – because many relied heavily on Russian energy supplies.
Prices rose by about 2 percent a year on average until 2022 when annual inflation in the EU hit 9.2 percent.
The surge was driven mainly by energy costs. Inflation has since eased, but the price rises of the COVID-19 pandemic and the war in Ukraine have not reversed.
Related News
European Union backtracks on Canada becoming ‘associate member’

‘Bordering on angry’: The state of play as US midterms enter final month
‘Unprecedented’ cyberattack hits French supermarkets, causing food losses